Data Visualization for Business
Would you like to “see” or “read”? No doubt, viewing is easy and comfortable for Anyone. Because reading is more difficult than viewing. Also, screen reading needs additional effort and web visitors are more likely to go away. But this has come as an analytical way for a business website. So, dealing with data in a business has to be proficient in data visualization since it is an effective tool for studying, evaluating, and conveying data. “Data Visualization for Business” is today’s gift.
Shall we dive in deep?
What is data visualization concerning the business?
Traditional types of data are useless in this fast-moving technological world. You have to find really good and new methods to do so. Agreed?
A graphical depiction of information and data is called data visualization. To assist individuals in comprehending and interpreting complicated data.
it makes use of maps, graphs, charts, and other visual aids.
A customer may quickly and easily understand the main patterns and insights found in the data by using data visualization, which aims to present information effectively and clearly.
In many different domains, such as business, finance, healthcare, research, and more, data visualization is crucial to data analysis and decision-making.
People who see data visually are better able to spot correlations, patterns, and trends that may not be immediately obvious when viewing raw data as is.
Making more informed judgments and acting on data-driven insights can be aided by this.
A few popular forms of data visualization are;
- scatter plots,
- heat maps,
- bar charts,
- line charts, and
- maps.
Data storytelling is a technique trending. Looks like the next step of data visualization.
Different audiences and objectives may benefit from different representations, and each sort of visualization is ideally suited for a particular set of data and information.
How to make use of data visualization for an online business?
Any internet firm may benefit greatly from the use of data visualization. You may obtain insightful knowledge that will help you make;
- significant improvements to your website,
- marketing initiatives,
- and overarching company plan by converting unprocessed data into comprehensible and clear graphics.
The following are some strategies for utilizing data visualization in your web business.
1. Recognize Your Clientele
Transform website traffic data into a visual format by utilizing charts to;
- observe visitor origins,
- most-visited pages, and
- duration of stay.
This can assist you in determining areas that require development, such as content customization based on user behavior or website optimization for particular demographics.
These are basic analytics. There are further advanced tools for creating more helpful insights. As an example, AI tools are there to boost this task.
1.0 Examine consumer behavior
Keep tabs on user activities on your website, including purchases, add-to-carts, and product views. To comprehend client journeys and spot any drop-off spots in your conversion funnel, visualize this data.
2.0 Boost Marketing Initiatives.
Analyze click-through, impression, conversion, and return on investment statistics for your advertising efforts to keep tabs on campaign effectiveness. You may use this to determine which campaigns are the most successful and where your money can be spent most efficiently.
Analyze social media interaction by keeping an eye on metrics such as comments, shares, and likes on your postings.
Make use of visualizations to determine the kind of material that appeals to your audience so that you can adjust your future marketing tactics appropriately.
3.0 Help Make Business Decisions.
3.1 Determine sales trends
Utilize graphs and charts to observe how sales are trending in time, by product category, or by region. You may use this to determine which goods are in demand, forecast demand in the future, and make wise inventory management choices.
Monitor competition performance by comparing your performance metrics with those of your competitors using data visualization tools. This might assist you in pinpointing your areas of weakness and formulating plans to obtain a competitive advantage.
The business world is changing rapidly.it’s your responsibility to level up the technology over business. Are you ready?
So, let’s show you how to do this.
How does data visualization improve Business Intelligence?
BI is now dominating the business world. By converting complicated datasets into understandable, aesthetically pleasing representations, data visualization dramatically increases the efficacy of BI Business Intelligence and facilitates better understanding & decision-making.
So, these are the key factors for that.
1.0 To be clear and understandable
Clarity matters. Trends, patterns, as well as correlations are easier to understand when complex data sets are shown using tools like charts, graphs, and dashboards. This facilitates improved understanding among stakeholders by enabling a faster grasp of insights and trends.
2.0 Monitoring in Real Time
PIs- Key Performance Indicators with trends can be tracked in real-time with the use of dynamic visualizations & interactive dashboards. Users are now more equipped to monitor developments, spot anomalies, and act quickly.
3.0 Understanding Discovery
The discovery of trends, anomalies, and linkages within data that may be missed in raw data or text-based reports is made easier by visual representations. This speeds up the process of finding practical insights that are essential for making decisions.
4.0 conveying Ideas
Visualizations are effective communication tools that help stakeholders understand information more quickly and intuitively. They help persuade and influence decision-makers by displaying data in an engaging and easily assimilated style, which enables effective storytelling.
5.0 Improved Cooperation
Collaboration is facilitated by visualizations, which make it easier for teams to exchange and discuss data insights. They foster data-driven conversations among team members, facilitate debates, and align interpretations.
What are the Data Visualization Techniques
1.0 Select the appropriate chart type
There are several options for data visualization, including pie charts, bar charts, line charts, and heat maps. Select the type of chart that best illustrates the information you want to convey.
2.0 Remain straightforward and unambiguous
Refrain from overly populating your visuals with data or colors. Make sure to emphasize the most important discoveries and patterns.
3.0 Incorporate interactive elements.
To enable consumers to delve further into the data, think about using interactive visualizations.
Keep in mind these 3 and let’s jump into the tools.
How do I select the best data visualization tool?
“The best” this question is not perfectly asked. Why? This term should come from the software side, by the company side both together. understood? while it’s an individual aspect. Because every software may have
- varied capabilities,
- benefits, and
- drawbacks for data visualization, t
there is no one-size-fits-all answer to this subject.
If you don’t search for “the best”, means you are smart. Yet, the following are some potential standards for assessing and contrasting various software.
However, we can advise you to think of some important aspects.
The function.
As the 1st one, How effectively does the program carry out the fundamental operations of data visualization, including importing, organizing, converting, evaluating, and presenting data?
What kinds of maps, dashboards, graphs, charts, etc. can be made using the software?
To what extent are the visualizations modifiable and interactive?
SO, NOW YOU KNOW WHERE YOU ARE GOING!
Compatibility.
To what extent does the software work with other platforms and tools? What kinds of sources and data formats is the program able to import and export? How simple is it for the program to publish and distribute the visuals offline or online?
Price.
How much does it cost to buy and keep the software? Is the program proprietary, open-source, or free? What type of support, subscription, or license is needed for the software?
Practicality.
If you have better answers to these questions, are in the right stream.
To what extent is the program user-friendly?
What type of user experience and interface is provided by the software?
To what extent are the menus, choices, instructions, etc. intuitive and easy to use?
To what extent does the program manage exceptions and errors?
It means now already found the right platform for Data Visualization for Business.
Can AI be used for Data Visualization for Business?
For basic tasks. Yes, of course. well, while, AI is becoming a master tool.
When Artificial Intelligence is used to create PowerPoint presentations, its basic principles are NLP-Natural Language Processing for text comprehension, data visualization for information display, and occasionally machine learning algorithms for content and slide layout optimization based on user preferences or preset templates. Using text, graphics, and charts to effectively communicate information, the AI evaluates the incoming data or language, pinpoints the main points, and creates presentations in response.
Did try famous methods of data Visualization for Business?
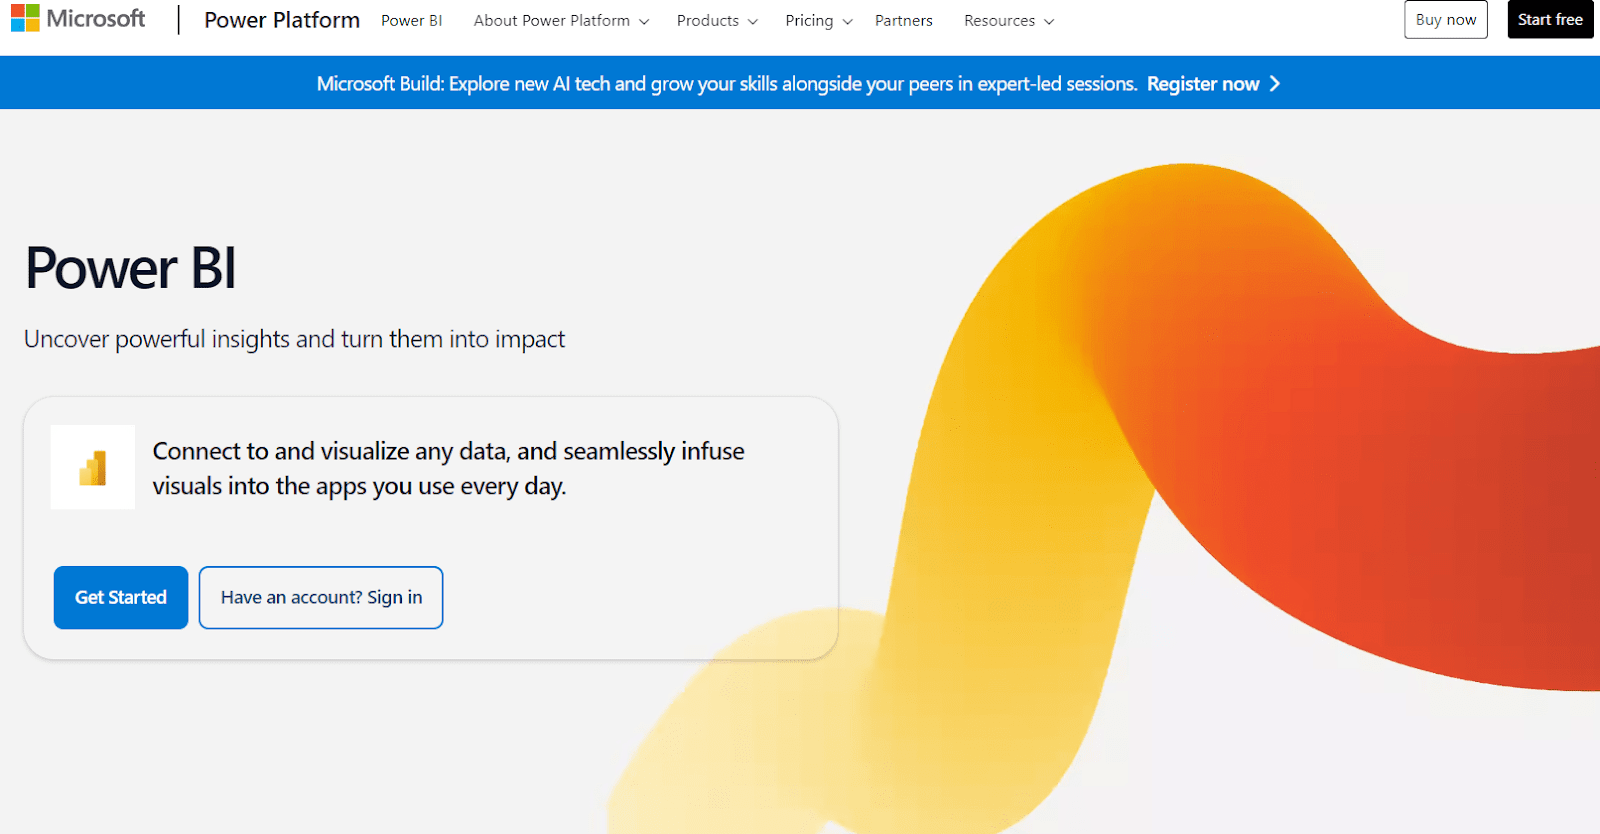
PowerBI & Tableau are dominating significantly. Tableau and Power BI are two excellent solutions for corporate data visualization. They let you take complicated datasets and create dashboards, graphs, and charts that are simple to grasp. Businesses may gain greatly from this in a variety of ways.
See the comparison table below.
1.0 Smart decision-making
Businesses that can visually perceive data are better equipped to recognize patterns, trends, and outliers that may be harder to discern from a spreadsheet. They may use this to make better-informed decisions on product development and marketing strategies, among other things.
2.0 Improved communication
Explaining complicated material to a large audience may be greatly aided by the use of data visualizations. They may be used to share data with key audiences, elucidate patterns to staff members, or even narrate a customer tale about your company.
3.0 Enhanced productivity
By simplifying the process of identifying and monitoring important KPIs, data visualizations may help organizations save time and money. This can aid in locating opportunities for cost- or efficiency-saving measures.
PowerBI vs Tableau
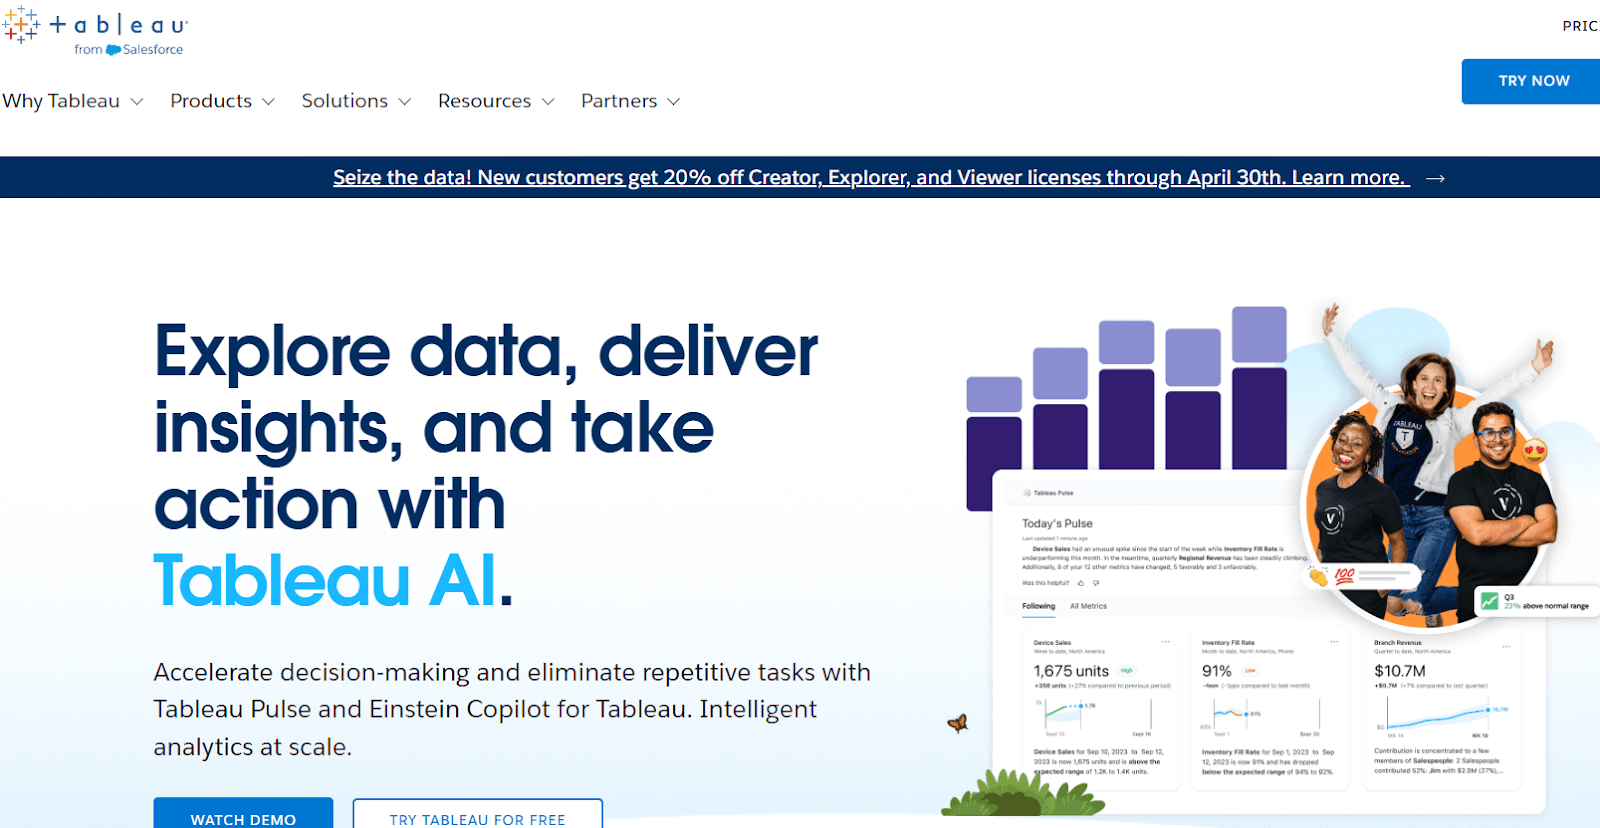
Look at this feature comparison
| DATA VISUALIZATION | PowerBI | Tableau |
| 01: User-friendliness | Simpler to understand and use, especially for people who are already familiar with Microsoft products. | For more experienced users, Tableau offers greater customization and flexibility, but it comes with a higher learning curve. |
| 2.0 Pricing | Power BI is a wonderful choice for enterprises on a tight budget because it offers a freemium approach | Tableau is more costly, particularly for implementations at the corporate level. |
| 3.0 Sources of data | Power BI is more tightly integrated with Microsoft products like SQL Server and Excel. | Tableau has a greater range of data source connections, including online services and cloud-based databases |
| 4.0 Customizing options | Power BI is more constrained when it comes to dashboard and visualization customization | Tableau provides more sophisticated possibilities. |
By the way, do you know that there is an advanced way? Related to Data processing and data visualization for machine learning?
Shortly, this will be a trending reach-out. This is how it goes.
What is the machine learning targeted data visualization technique?
Indeed, understanding data visualization and preprocessing is crucial for machine learning. To prepare data for machine learning algorithms, preprocessing includes cleaning, organizing, and modifying the data. This stage is essential to guaranteeing the model’s efficacy and correctness.
On the other side, data visualization facilitates understanding of the relationships and patterns found in the data. It also helps in informing stakeholders of findings and outcomes.
Then next, Acquiring these abilities will help you create more accurate and sophisticated machine-learning models in addition to improving your comprehension of the data. Missing values, outliers, as well as other data problems that might impair the performance of the model can be found and dealt with with the use of appropriate data pretreatment and visualization approaches.
Furthermore, you may utilize data visualization to enhance the prediction capacity of your model by identifying significant characteristics and correlations in the data.
So, certainly, For anyone interested in machine learning, knowledge of data preparation and data visualization is needed.
They are essential to a machine learning project’s success and may significantly raise the efficacy and accuracy of your models.
Therefore, dedicate some effort to mastering these abilities if you want to become a skilled machine learning practitioner.
Summary
Presenting information graphically improves comprehension, facilitates communication, aids in decision-making, and engages audiences. This is the goal of data visualization. Infographics, charts, and graphs help to simplify complicated data so that it is easier to understand and evaluate.
Data visualization makes it possible for stakeholders to swiftly gain insights, effectively convey results, and make defensible decisions through the transformation of raw data into aesthetically pleasing representations.
Hope this content helps
Cheers!
Read more on related topics here Power BI, Data Storytelling