METRICOOL-SOCIAL MEDIA ANALYTICS
Metricool-social media analytics is the coolest trend for social media scheduling and analytics. so Metricool gives some amazing metrics. can use on many digital platforms.
in order to find better insights.SaaS startup with 400k+ users. enable users to plan their posts and tasks easily.
improves your social media strategy. that’s why this platform has become popular.
if you know the real requirement, you can create opportunities.

What is Metricool?Why you now focus on 3 ways
Metri cool-social media analytics gives 3 main options. what are they?
01: Sheduling
This tool allows you to plan posts and tweets to schedule when they should appear on the profile.
when the best time to reach the message will come out, for different days and hours.
02 Automating
you can pre-design them and automate them in the real-time they are to publish.
Auto lists along with content recurrings
In this way, Metricool upload articles automatically from your website. this will help you to find out about followings & un-followings. also to identify new followers.
competitor analysis is important to know which contents work best. which tweets are really successful and how.
03 Maximizing
The data of Metricool can use to maximize your business. and the long term analytical data will lead you to grow the process
Check list & brief description
- Profile outlook
- Posts & lists
- comments
- Interactions over the posts
- The community
- About followers
- Stories
- # tags
- More statistics
Example: Instagram
01: The account- profile
Profile views: Instagram profile visits
impressions: The number of times that the profile/ publications show. including organic and paid data.
Posts: Total posts count published selected period
Average reaches per day: Average number of visitors reach with publications. The average=days count. It including organic and paid data.
Website visits: clicks count on the URL.
02: Statistics on Posts
Engagement of your publications. The engagement rate=no. of interactions per 1000 people reached.
Interactions: interactions count on the posts published in the scheduled time.
Avg. reach per post: The average number of people reached by your publications. This average calculates the number of posts.
Impressions: The count that publications show. remember this collects only organic data. If you want to access the paid data follow the above method
Posts: post count publishing in the period of scheduled.
03: Interactions on posts
Likes: likes count on posts publishing in the scheduled period.
Posts: posts count publishing in the scheduled period.
Comments: comments count on posts same as above
Saved: count of post publishing in the period(like above)
also, some additional information on daily wise,
- likes
- likes per post,
- comments,
- comments/ post,
- likes/ comment.
04: List of posts
Type: post in primary: link only/ with video/ image.
Date: Publication date.
Comments: comments count for each publication.
Reactions: reactions count receive for each post: Like, Love, Haha, etc.
Shares: share count on the publication.
Clicks: clicks count for each publication.
Link Clicks: Clicks on the link including in each publication.
Impressions: display your count publications. by considering the organic and paid data.
Reach: the count of reached people for each publication. It considers the same as above.
Video time watched: videos play/ time.
Video views: your video watch time for at least 3 seconds. similarly its total length.
Engagement of your publications. This is the number of interactions/ 1000 people reached.
05: Competitors
you can have clear analytic data on competitor’s
- likes
- posts
- followers
- comments
- engagement(facts per 1000 people)
after that, you can freely select the time period.
06: list of stoires
- Publication date
- Impressions( for organic data)
- replies (relpies for each and every story)
- Reach :the count of reaching followers (for organic data)
in addition, you can see the taps back/taps forward. and the number of exits without engagement.
therefore the data for stories publish count & impressions can see. however, that is coming with organic data. average reach per story also can view.
07: # tag info.
Impressions: impressions count of a post that including a #tag. If the hashtag is involved in multiple posts, it comes to average.
The number of posts: posts count that including each hashtag.
Likes: Likes on publications that used each #tag. If the hashtags were in multiple posts, it comes to average.
Comments: comments count on publications using each #tag. If they were using in multiple publications, =average value counts.

How to improve your online buisness with Metricool: 4 ways
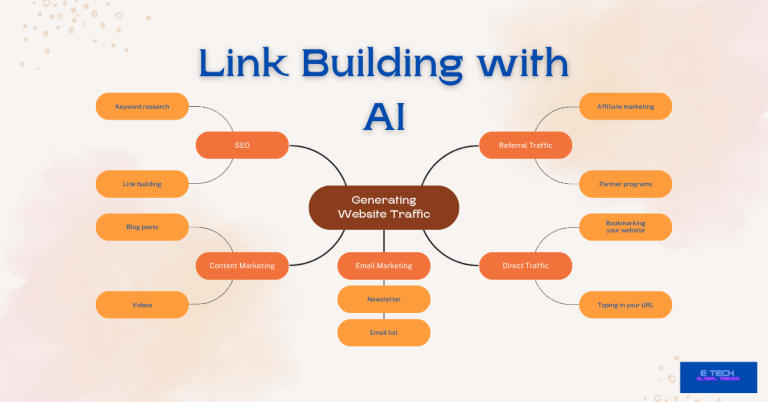
01: Focusing website traffic
This tool gives you to analyze data. and it will help to track website traffic.
- Detais on Site visits
- like most visiting pages
- sources-shows which are from?
- locations-which zones they are coming from
- comments
02: Connection view from diffferent social medias
Identify your complete growth. and shows the performance of each post. like other media platforms.
03: Campaign analyzis
you are free to see the analytical information on AD campaigns. this is working with google.
04: Research on competitors
“Metricool” monitors the competitor’s growth through their social media networks. this definitely helps you to make your strategy stronger.
If you plan accurately, can see the goals forthcoming.